Skip to content

Every answer
has a story.
See it unfold.

Connect requests and traces to sessions, users, departments and your own custom properties. See what happened, who it served, and what it cost.

From request to responseTrace / Inspect / Understand
Inside a request: timeline, nested calls and response details Illustrative travel-planning session with model calls, weather and flight tools, knowledge retrieval, timings and the corresponding system, user and assistant messages. Session traceCompleted SPAN0s2s4s6s Travel planWeather APITravel advisoriesRetrieve travel tipsFlight booking APIFlight summaryHotel search APIHotel reviews Travel planning assistantSuccess 6.01s4,286 tokens$0.0084 Session travel-24User [email protected]Department Operations TRACEDURATION MessagesMetadataProperties LLMTravel plan0.631sToolWeather API0.802sToolTravel advisories1.187sLLMRetrieve travel tips0.412sToolFlight booking API1.683sLLMFlight summary0.399sToolHotel search API1.457sSearchHotel reviews0.434s systemYou are a travel itinerary planner.Use tools and knowledge to plan the trip. userPlan a trip to Costa Rica for June 10–17. assistantHere’s your itinerary, with flights, hotelsand recommendations for your trip.
Illustrative trace · Available detail follows your logging settings

01 / Traces & business context

Every request.
The whole context.

Follow a request through its model and tool calls, then connect it to the session, user and department behind it. Add custom properties to track the context that matters to your business.

Request anatomyReduced motion
Follow the path from a request to its traceAn illustrative request reaches a model, branches into two tool calls, and returns to a response. The trace below records the model and tool sequence, connected to sessions, users, departments and custom properties. Moving blue marks illustrate the flow, not live traffic. ONE REQUEST. THE FULL SEQUENCE. Incoming request Model call Tool call 01Tool call 02 Model response CAPTURED TRACESequence · Timing · Context ModelToolsResponse SessionsUsersDepartmentsCustom properties
Illustrative flow. Captured detail follows your logging configuration.
01.1 / Execution

Follow every captured step.

Inspect model and tool calls, execution times, inputs and outputs in the same trace.

01.2 / People & sessions

See who—and what—it belongs to.

Connect activity across sessions and users. Bring department context into the record to understand how teams use AI.

01.3 / Custom properties

Your business. Your context.

Attach the properties you care about, such as an application, workflow, project or customer reference. Keep that context alongside the request.

02 / Request records

Start with a question.
Find the request.

Bring provider, model, token usage and spend together with the session, user and custom properties attached to the request. Investigate with the technical and business context in one place.
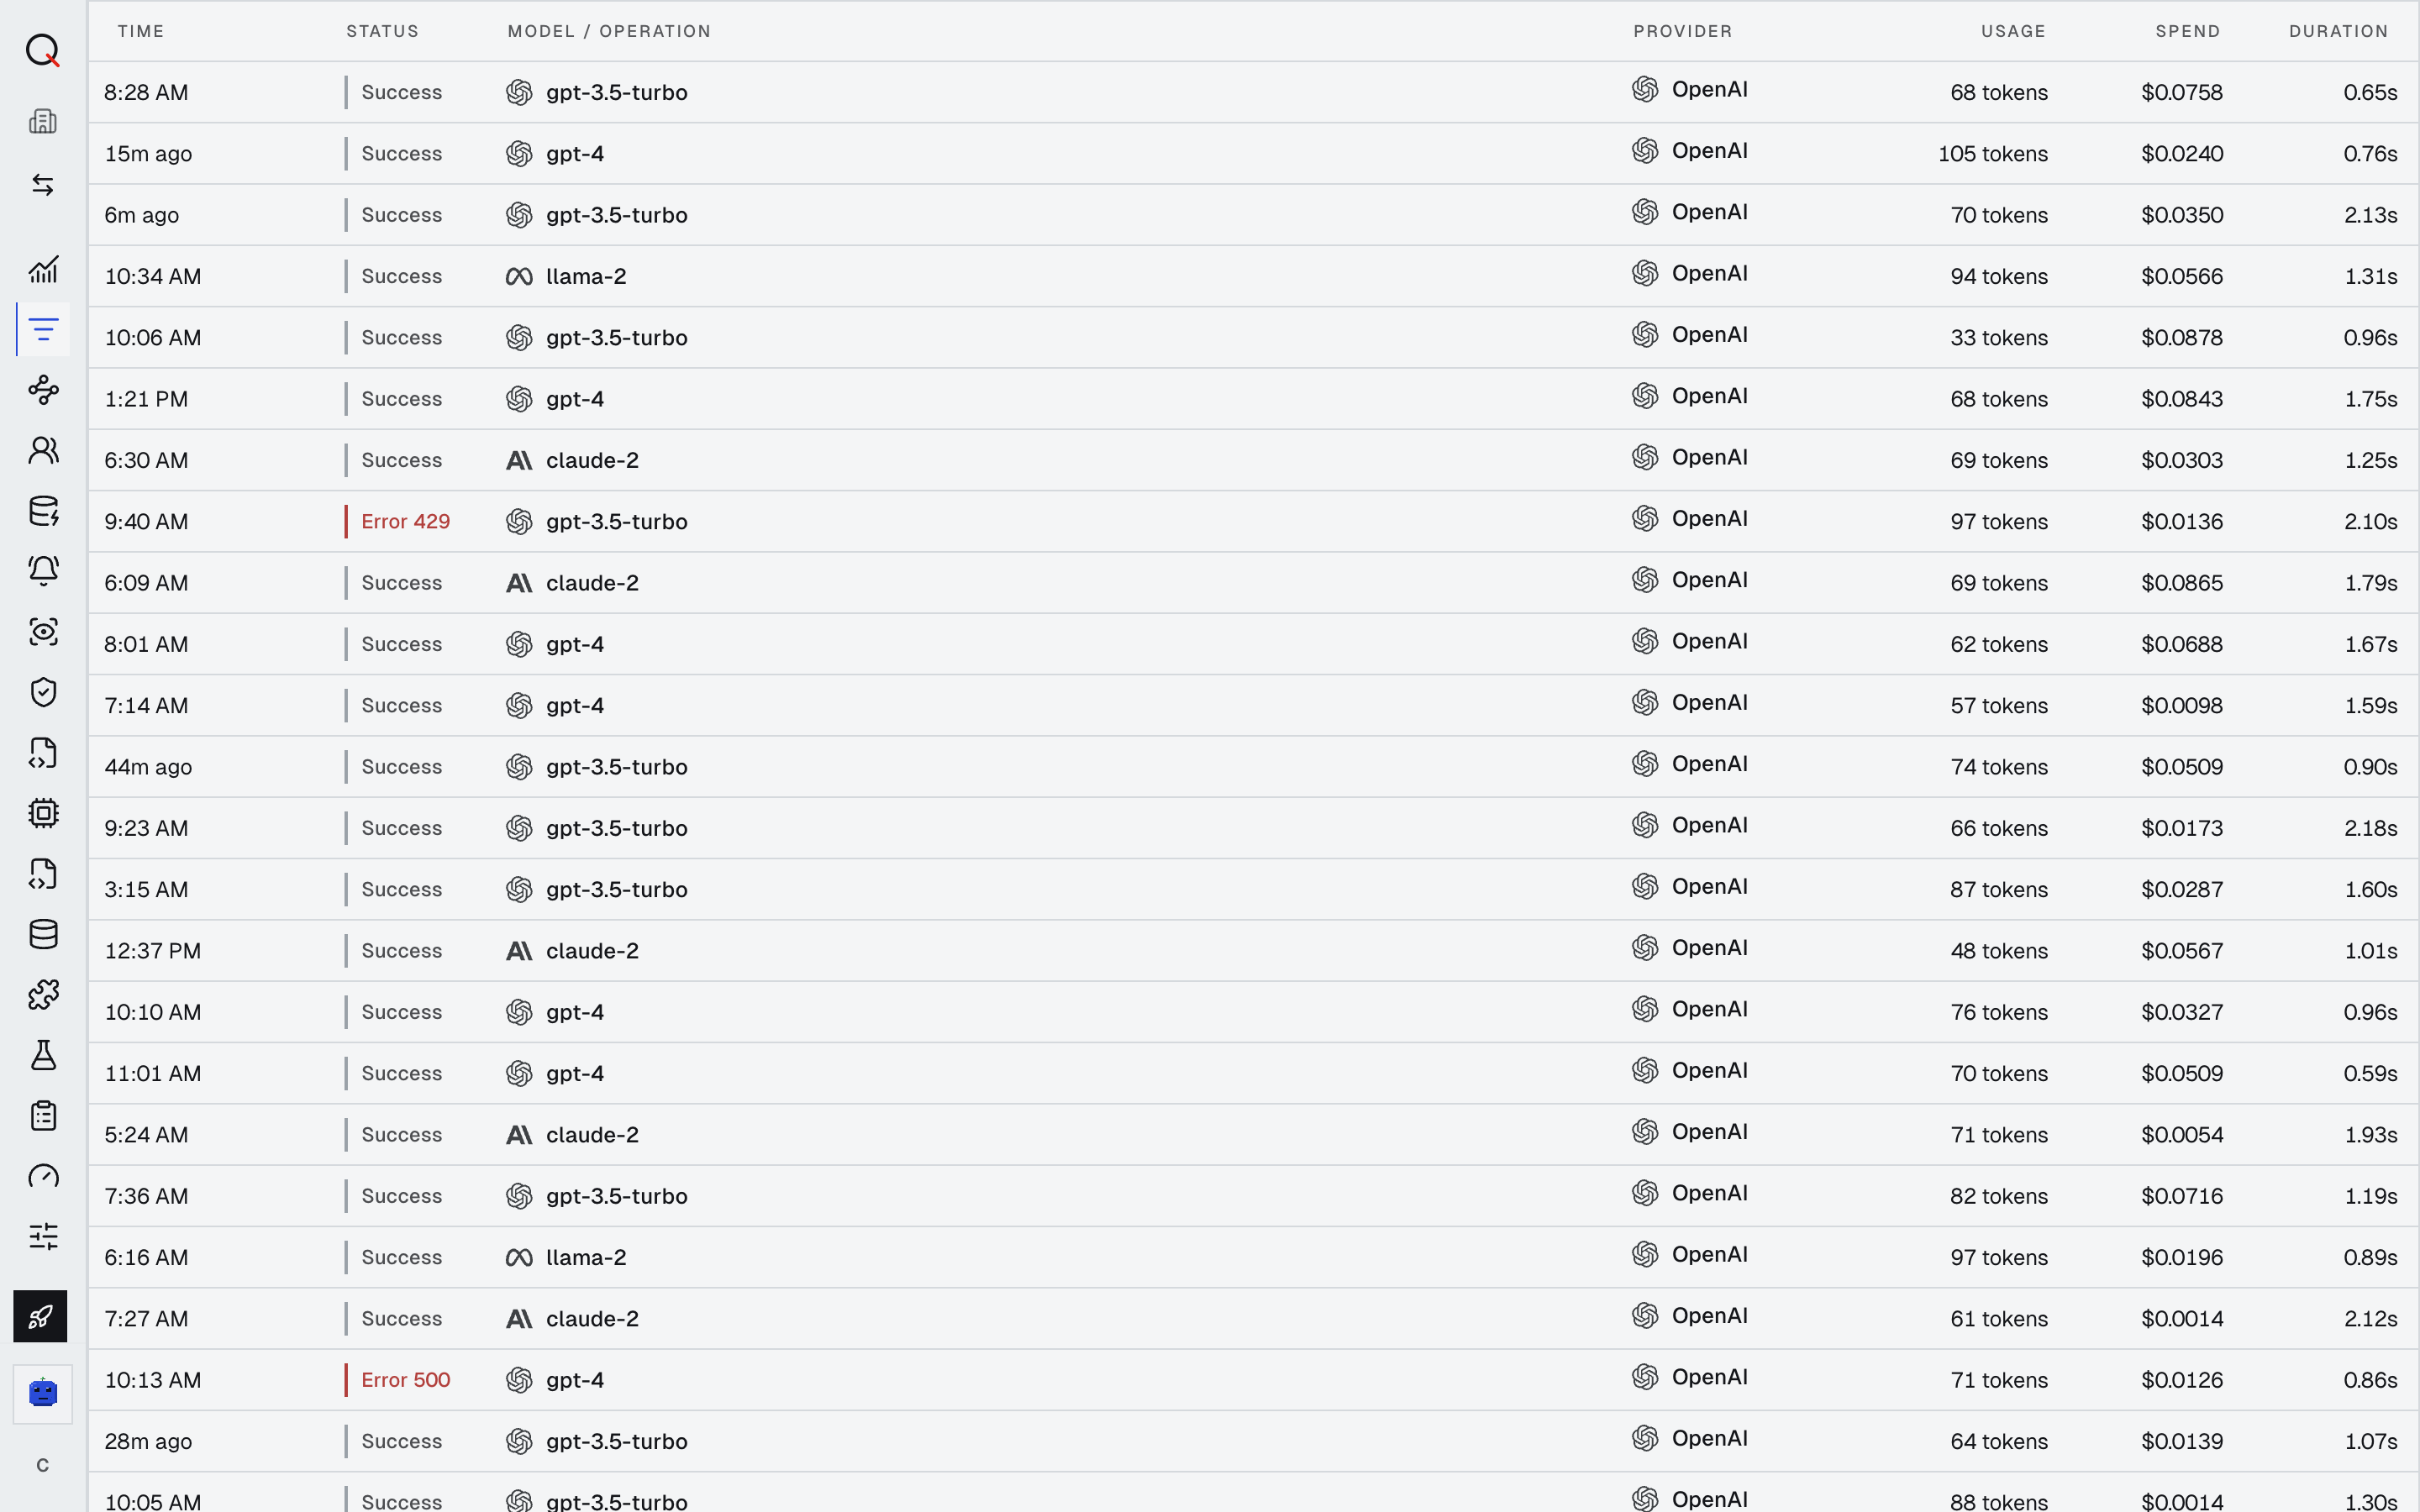
Sample product request table with status, model, provider, token usage, spend and duration.

01 / Inspect an error

Which request failed?

9:40 AMError 429gpt-3.5-turbo$0.01362.10s

Find the failed request. Bring its status, model and timing into focus.

02 / Understand request cost

Where did the spend go?

10:06 AMSuccessgpt-3.5-turbo$0.08780.96s

Connect recorded spend to the request and model behind it.

03 / Investigate latency

Which request took longer?

9:23 AMSuccessgpt-3.5-turbo$0.01732.18s

Locate a slower request. Follow its captured trace to understand the work behind the response.

Which model?

See the provider and model attached to each captured request.

What did it use?

Review token usage alongside recorded spend and duration.

What happened?

Keep the available record as the starting point for investigation.

03 / Usage & cost

Make AI activity
something you can explain.

Move from individual requests to the wider picture. Understand request volume, cost and latency with the user, department and custom context your team tracks.
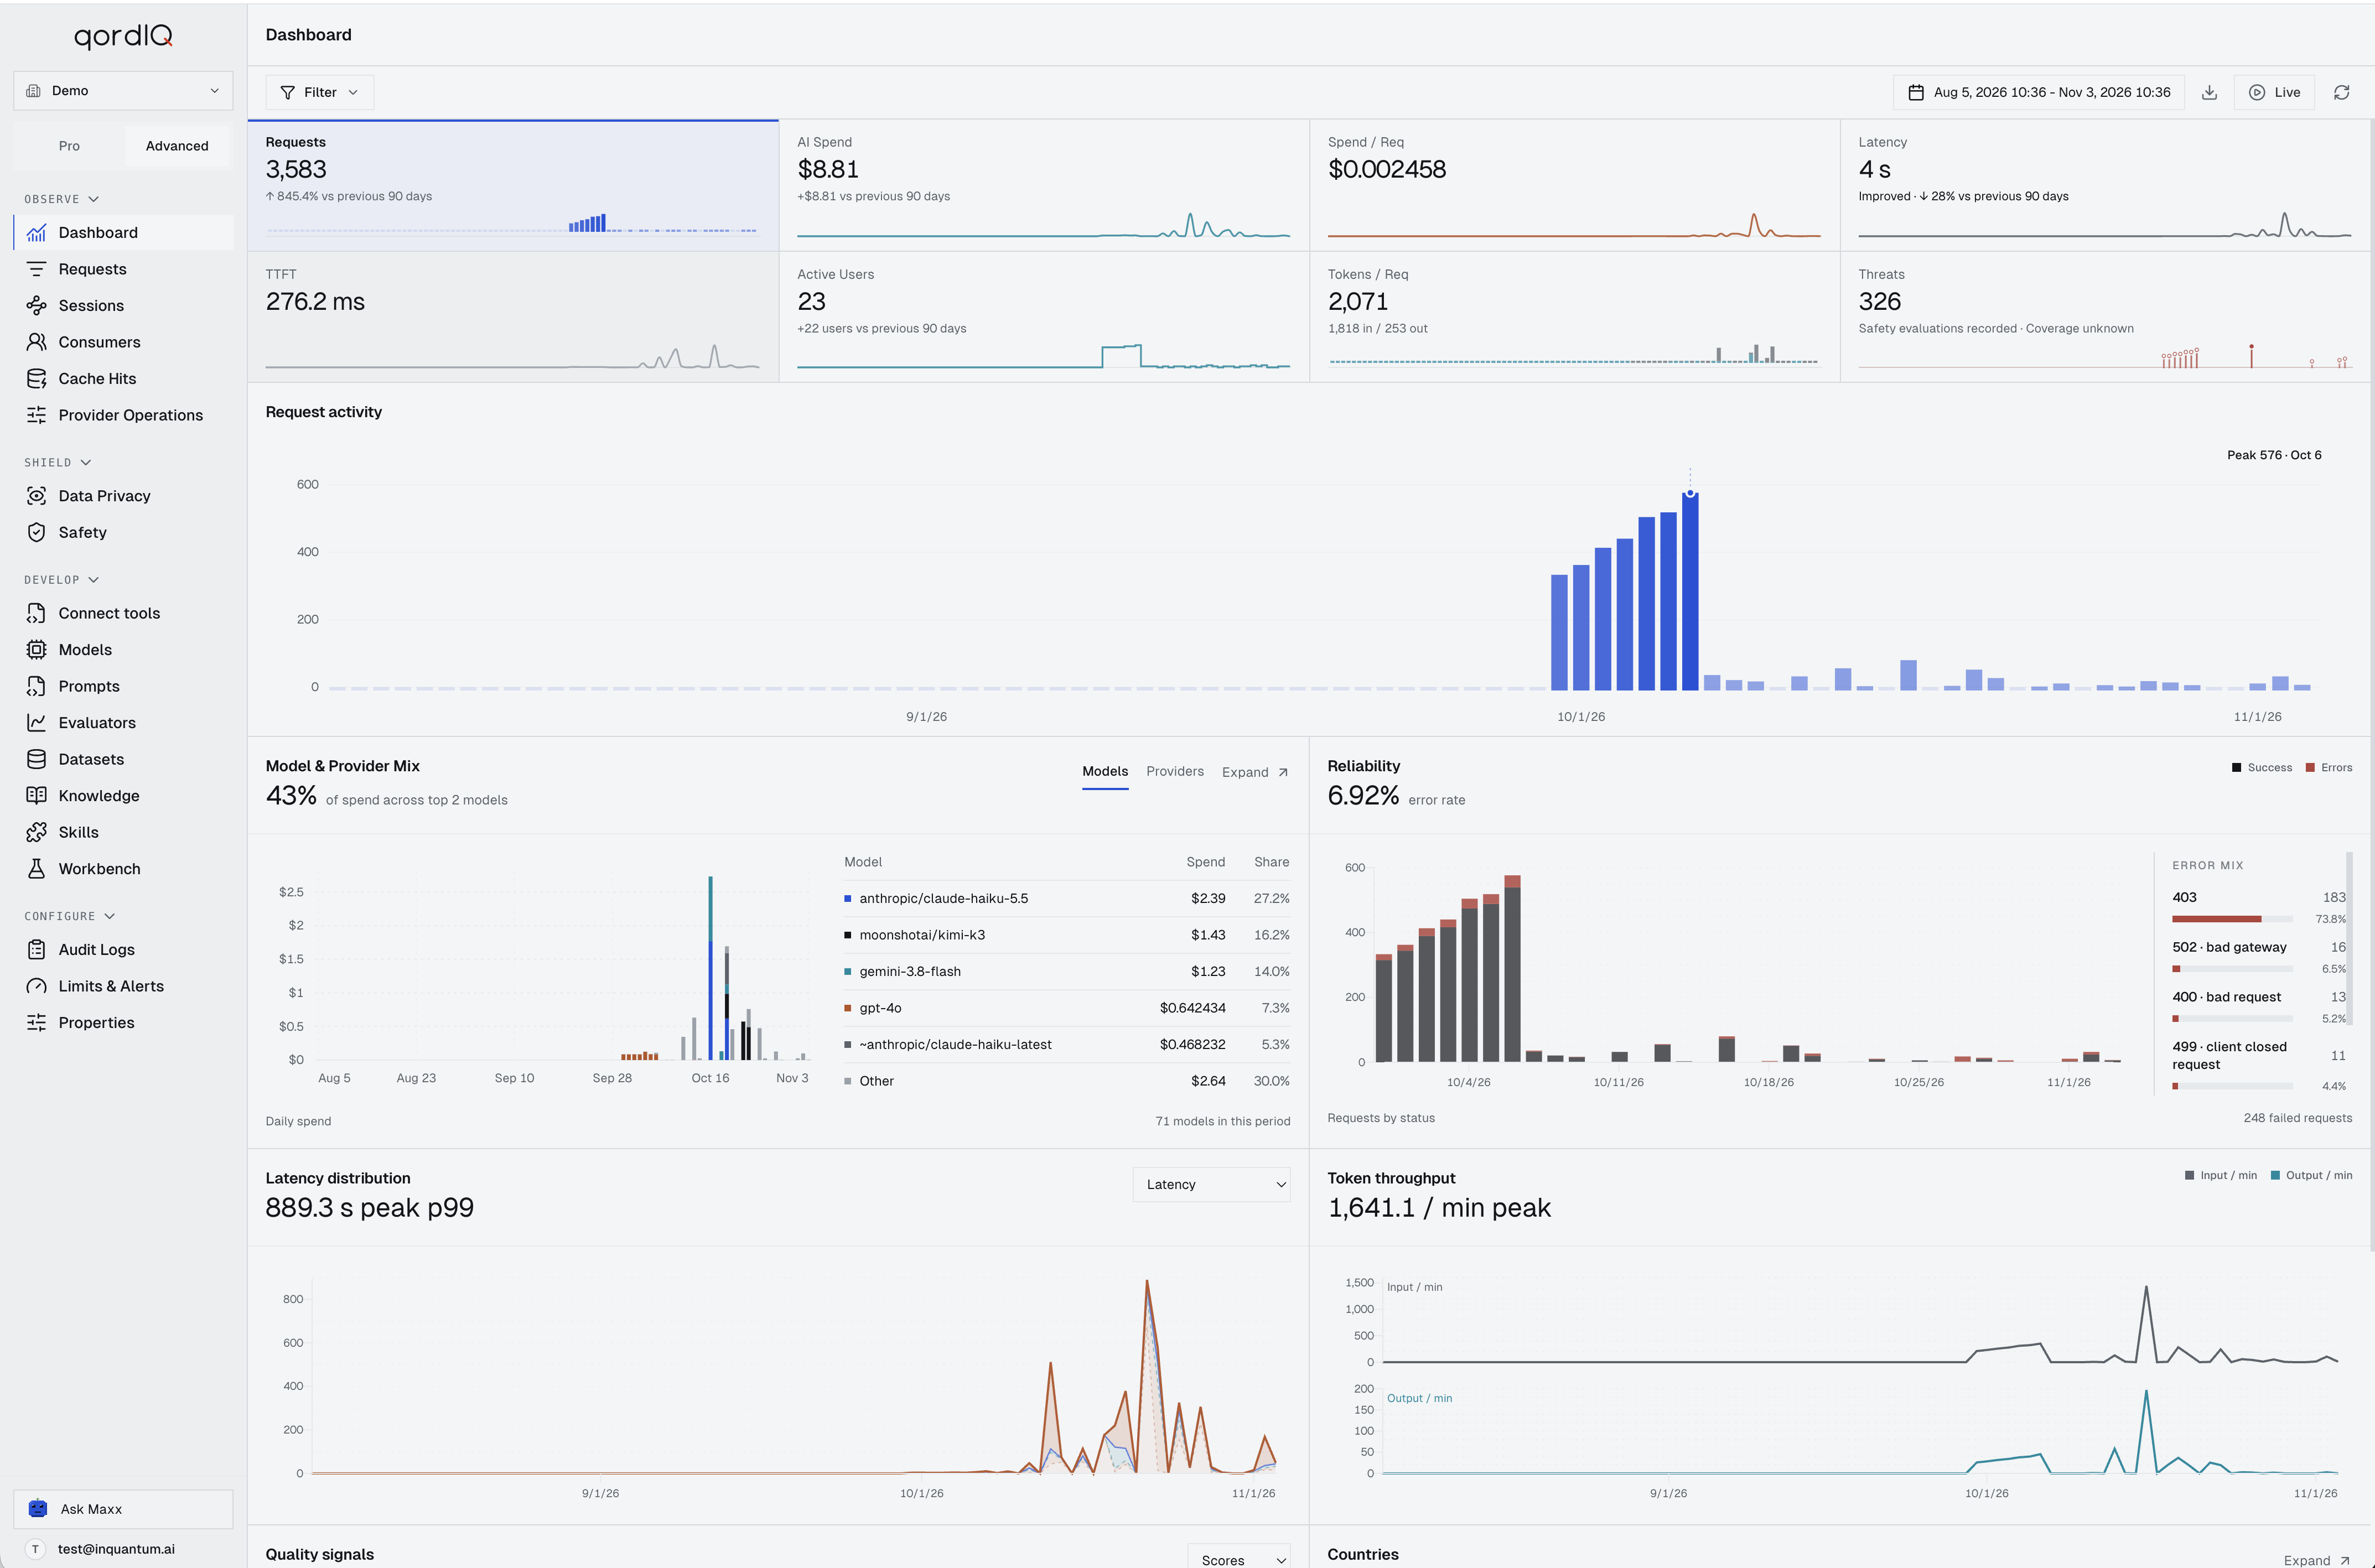
QordIQ dashboard showing request activity, AI spend, model and provider mix, reliability, latency distribution and token throughput.

Connected at the gateway

Visibility belongs
where the work happens.

Your workspace, applications and compatible tools share the gateway. Observability brings their captured activity into a common view.

Explore the AI gateway

The record your team controls.

Available detail depends on your logging configuration. Access settings determine who can review it.

Access & controls

Data handling on the same path.

Apply configured sensitive-data rules to supported requests before they reach a provider.

Data protection

QordIQ Observability

Understand the answer.
And everything behind it.

See how traces, request records and usage fit into your AI workflows.

Talk to us about observability